Sunday, April 10, 2011

View Call Hierarchy window in Visual Studio 2010

Visual studio 2010 Ultimate is great IDE(Integrated Development Environment) and I am loving more and more whenever I found some thing new. While doing some Code and Review and other stuff with Visual Studio 2010 I have found one of most interesting feature in Visual Studio 2010 called “Called Hierarchy”.You can navigate your code better with the Call Hierarchy feature in Visual Studio 2010.
To check out let’s Create a sample asp.net MVC application like following .
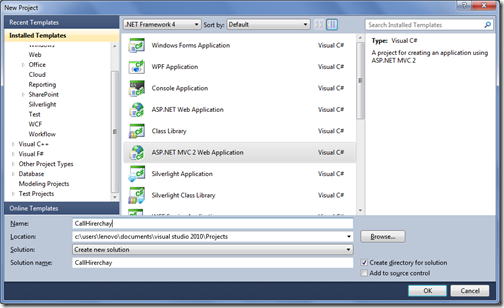
CallHirerchay

After creating a ASP.NET MVC 2 application it will create a basic simple application and we can run it and We have two views like home and about. We will check few code with Call Hirarchy. We can enable Call hierarchy window with two way one from the View->View Call Hierarchy like following or you can also use the shortcut Ctrl+Alt+K.
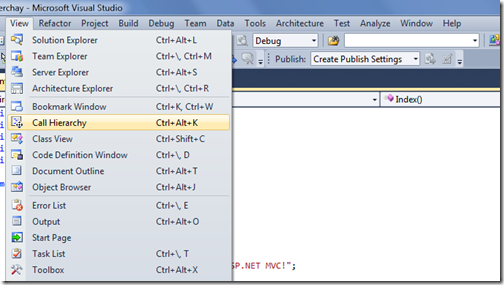
CallHirerarchywindow 

Now lets check the Account Controller-> Logon Action Result with call hierarchy You can also enable call hierarchy with selecting the Logon action and right click –> View Call Hierarchy like following or You can use the Shortcut for that like Ctrl + K,Ctrl + T.
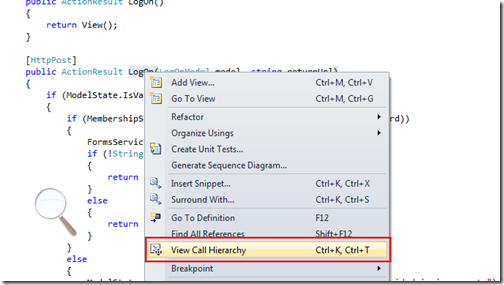
ViewCallHierarchy 

Once you click the call Hierarchy It will open the code that is called logon and also call made from the logon method like below.
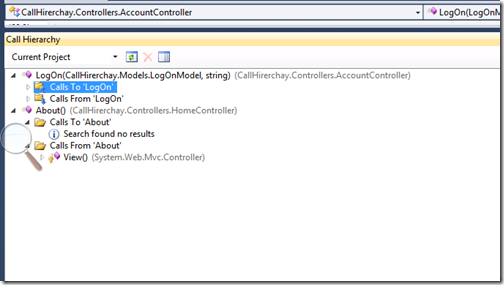
CallHierarchayforLogin

One you expand the both ‘Call To LogOn’ and ‘Calls from LogOn’ you can see all the calls Since there is no call for Logon on asp.net mvc sample application it will say but you can see calls made from it like following.
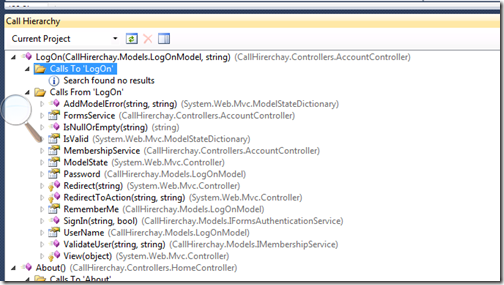
DetailOfCall

And on double click on any method or property will navigate you that code. Like I have double clicked the IsNullOrEmpty I have navigated to string class with that property.
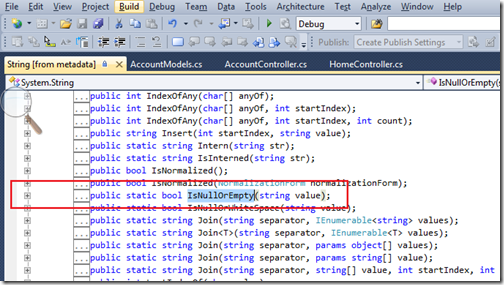
StringIsnullOrEmpty

That’s it. So you can see its a great way to navigate code for code review and code inspection. Hope you liked it.. Stay tuned for more.. Happy Programming..

Shout it

kick it on DotNetKicks.com
Share:
Saturday, April 9, 2011

Adding labels to breakpoint in visual studio 2010

With visual studio 2010 Microsoft has given a new features called to add/edit label in break point. This features comes very handy when you are having very large code to debug and You are having so many break points to debug. So, You can add the label to various break point and then use this label to understand execution of program. Let’s see how its works with visual studio 2010.

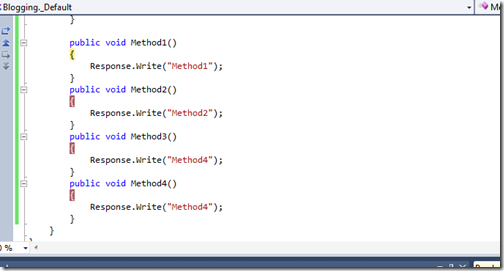
I have written following sample code to understand it better. This is a simple default.aspx page with four method to print a string on web page.

using System;
using System.Collections.Generic;
using System.Linq;
using System.Web;
using System.Web.UI;
using System.Web.UI.WebControls;

namespace Blogging
{
  public partial class _Default : System.Web.UI.Page
  {
      protected void Page_Load(object sender, EventArgs e)
      {
          Method1();
          Method2();
          Method3();
          Method4();
       
      }

      public void Method1()
      {
          Response.Write("Method1");
      }
      public void Method2()
      {
          Response.Write("Method2");
      }
      public void Method3()
      {
          Response.Write("Method4");
      }
      public void Method4()
      {
          Response.Write("Method4");
      }
  }
}

Here you can see there are four methods method 1,2,3 and 4 and each printing respective string with respective methods.

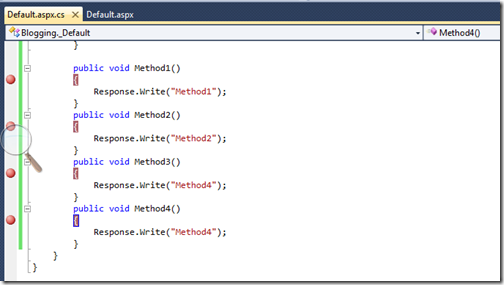
Now Let’s put four break point in visual studio like following.

Four breakpoints with four methods

Now let’s debug the web application via pressing F5 and then we will go one by one break point and will add labels. Now I am at first break point.

FirstBreakPoint

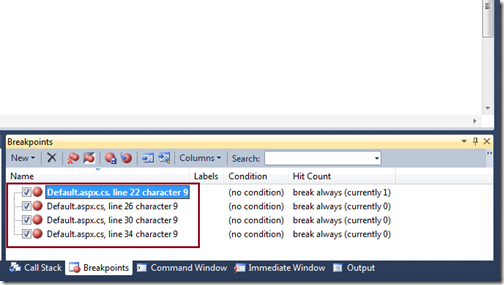
Now when you go to the break point window you can see all the break point over there like following.

BreakPointWindow

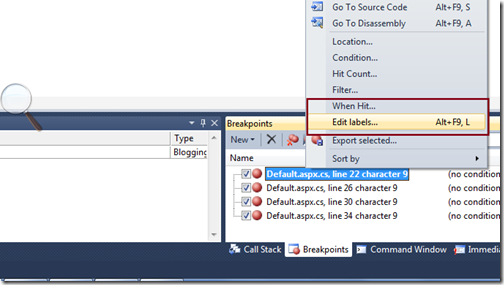
Now let’s Create a new label first for break point via selecting that row and right click edit label like following.

Edit Labels

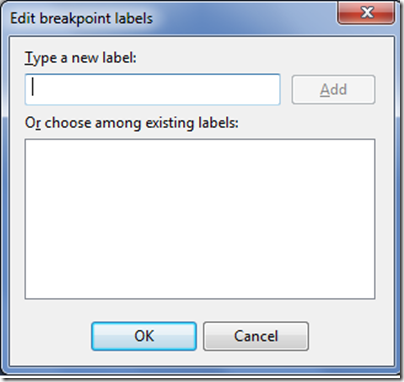
Once you click edit labels a window will appear which will ask for adding a new label for break point like following.

AddLabel

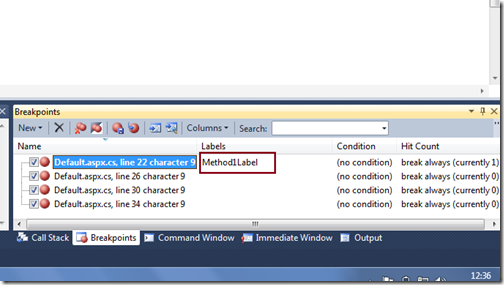
Now I am adding a new label called method1 label in this box.Now you can see the in break point window with a label just like following.

Method1Label

So now you can see the Method 1 Label is there so you need not to check this break point via clicking on that break point. You can remember this break point via clicking on this. That’s it. Hope you like it.. Stay tuned for more.. Happy Programming.

Shout it

kick it on DotNetKicks.com
Share:

Windows Azure camp in various city of India- Go Register it.


header_bootpage[1]

Microsoft is organizing the windows Azure camp in various cities of India. It’s a great chance to learn new things about Microsoft Windows Azure. So If you want to be part of that then you must register in this event. Following are date and cities information.

Ahmedabad- 10th April 2011 now postponed to 30th April( I will be there at 30th April 2011)
Banglore-30th April 2011
Chennai-9th April 2011
Delhi-10th April 2011
Hyderabad-10th April 2011
Kolkata-10th April 2011
Mumbai-9th April 2011
Mysore-10th April 2011
Pune –10th April 2011
Triavndrum –30th April 2011

Here is the link from where you can register for that event
http://www.microsoft.com/india/azurecontest/azurecamp.aspx

See you guys there.. Stay tuned for more..

Shout it
Share:
Friday, April 8, 2011

Historical Debugging (Intellitrace) on Visual Studio 2010 Ultimate Part-2

In the first post I have explained how historical debugging will going to work and how we can enable the historical debugging. In this blog post I am going to take one real time scenario and then we will see the How historical debugging will work. Here I have selected the second option for Intellitrace - Track event and call Information. I am going to check historical debugging with my asp.net application so following is a simple code for that.

using System;
using System.Collections.Generic;
using System.Linq;
using System.Web;
using System.Web.UI;
using System.Web.UI.WebControls;

namespace Blogging
{
 public partial class _Default : System.Web.UI.Page
 {
     protected void Page_Load(object sender, EventArgs e)
     {
         Response.Write("This is a page load event");
         ThrowHistoricalException();
     
     }
     public void ThrowHistoricalException()
     {
         throw new Exception("Historical Deubgging");
     }

 }
}

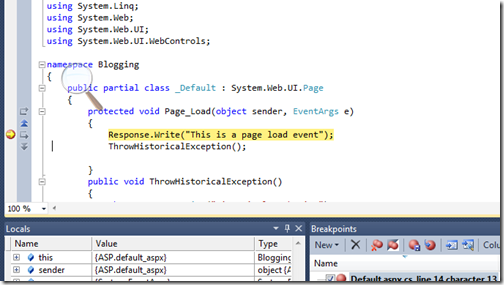
In above code you can see its very simple We are printing one statement on in page load event with Response.Write and then it will call a new method called ThrowHistoricalDebugging. Where it will throw a new exception. Now all ready to check let press F5 to debug this thing. I have putted the break point over Response.Write statement so We can trace everything.  so now debugging starts at my break point Just like below

HistoricalDebuggingBreakPoint

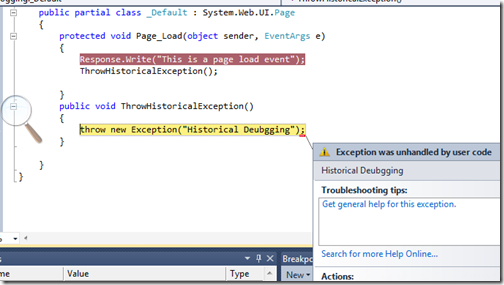
Now let’ proceed the things further now lets step in with the pressing F10 It will call ThrowHistoricalException and Here you can see the exception like following.

HistoricalDebuggingException

As You can see now the Exception thrown. Now lets move to IntelliTrace window what’s are information there.

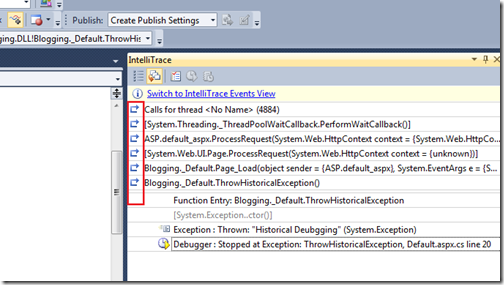
IntelliTraceWindow

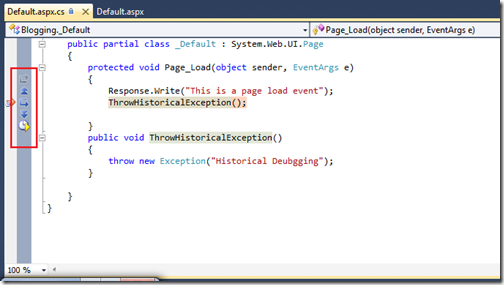
As you can see whole event and method trace information here in Intellitrace windows. Also you can see the A reviwnd Icon there so on clicking on that you can got the specific events and restart debugging. Now I have clicked on Page_load event and Now its going to the page_load event statement where the exception is thrown. Just like below.

IntellitraceRewind

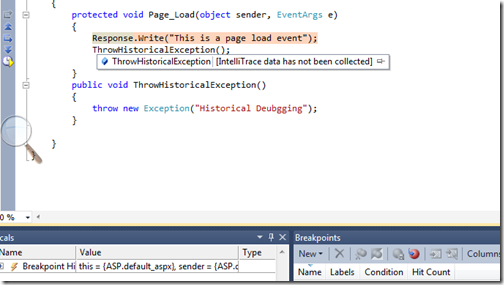
Also you can see there button given to move updown and other stuff to move your current point up and down. I have click move up and You can see in below image its moving up.

IntelliTraceUp

That’s it. As you can see its very easy to move up down and go back to location of code wherever you want with historical debugging. So now you can easily see what happens when your tester is reproducing the bugs. Hope you like it. Stay tuned for more.. Happy Programming.

Shout it

kick it on DotNetKicks.com
Share:

Historical Debugging (Intellitrace) on Visual Studio 2010 Ultimate Part-1

Visual studio 2010 Ultimate comes with one of most interesting function Historical Debugging which will change the way you debug. Let’s see what is Historical Debugging and How its works.

How historical Debugging works?

As as developer you have already faced some situations like Your tester reports a bug and you are not able to reproduce that bug in your local environment or you have very long steps to reproduce it and sometimes it reproduces under special condition and some times it does not. At that time this historical features comes into existence. With Visual Studio 2010 Ultimate Microsoft has introduced a new debugging tool intellitrace. It keeps a trace of important points of your program and its allow you to go back at that time to see what happened at that time. Isn’t that cool? that is just like rewinding your recording to edit your video.

How we can enable Intellitrace on Visual Studio 2010 ?

To enable it you need to go to the Tool->Options->Intellitrace->General just like following.

IntelliTracedialog in Visual Studio Dialog

There is a check box called ‘Enable Intellitrace’. You need to check that checkbox to enable IntelliTrace (Historical Debugging). There are two radio buttons

1) IntelliTrace Event Only- This option will enable historical debugging for the events only. So it will only keep track of events only. Not all the parts of code.

2) Intellitrace events and Call Information: This option will enable historical debugging for events and inner called like method and other stuff. It records method level call but due to that your application performance can be effected. You will not get high performance from your application.

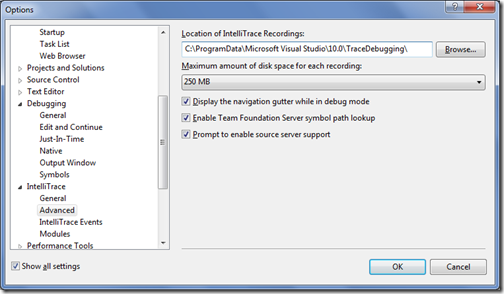
There are some advance options are also given in the options dialog box like following when you click advance in above dialog.

Advance of historical debugging in advnace.

Here you can specify the location of the IntelliTrace Recording and Maximum size of disk space for each recording.

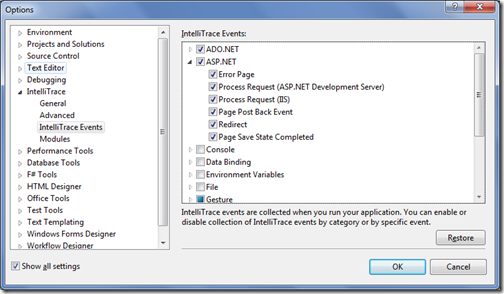
In Intellitrace Events options you can specify which kind of events you want to trace. I have enabled it on ASP.NET Project so I have options for ASP.NET and ADO.NET Enabled by default like following. But You can select events like file,Environment events and lots of options are available so you can specify that as per your requirement like following.

IntelliTraceEventsTypes

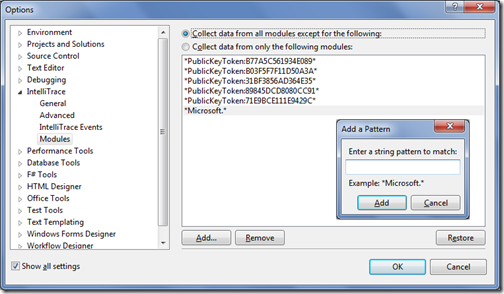
In Modules options you can select for which system modules you want to enable intellitrace if You can also add your own modules here with string pattern like following.

IntelliTraceModule

So,Now we all set for the Historical debugging(IntelliTrace) in Next Post I will demonstrate how historical debugging will work. Hope you liked it.. Stay tuned for more..

Shout it
kick it on DotNetKicks.com
Share:
Thursday, April 7, 2011

Important milestone achieved. This is my 400th Blog post

When I started this blog before four Years I was not serious about blogging. I was just started this blog to register domain against my name. After a while I was inspired by great community bloggers like ScottGu,Pinal Dave,Jacob Sebastian and some other friends like Vivek Patel. Then I started blogging seriously but at that time I was not aware of how to blog. I was just writing whatever I like or whatever I have found. I have no idea of syntax highlighting, blogging technique and SEO. Day by day I learned a lot and started working on things and as a Result of it Today I got 400th Blog post on my this blog.

I would like to thanks each and every reader and my fellow community blogger to helping me achieve this. Without them I could not achieve this.

Still I have seen there are lots of exceptional developers who are not writing blog. I would like to recommend that please read my blog post “Why a developer should blog?”. I must say once again that If you are doing great work then you should share it with the community and get their views of what you are doing.

On this occasion I would love to share some thoughts on blogging like following.
  1. Do not write blog to increase your blog post or get any recognition . Instead of this write your blog for self pride and community.
  2. Do no worry about who is going to read this blog. How you can increase your readers instead of that keep writing blogs and one day you will achieve whatever you like to do. Read your blog post once you posted it on your blog and it will give you great joy and satisfaction.
  3. keep inspired by your fellow community bloggers and try to improve your blogging.
  4. If you are technical blogger then Keep your post to give a complete solution of a problem because if readers will not get complete solution then they got frustrated with you.
  5. Learn and explore new things and share you experience on you blog.
  6. Always be good listener and you will learn a lot.
  7. Nobody knows everything. We all are learning everyday something so keep doing mistakes but learn from those mistakes and try to not repeat the same mistakes again.
Statistics of my blog:

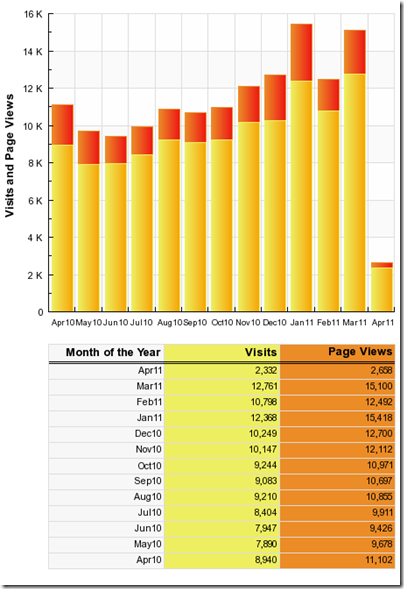
On this occasion I would like to share my statistics of blog below are my statistics of blogStastics

Once again I would like to thank the readers and all the fellow bloggers without them it was not possible to achieve this. Keep blogging.. Stay tuned for more..

Shout it
Share:

Checking whether page is secure or not in ASP.NET or JavaScript

Recently in one the project we require to check whether page is secure or not as we are going to open a new popup window from that page and that why we need to pass https protocol if we have that page secure. I have search lots of things on internet and I have found following ways of finding whether page is secure or not in ASP.NET or JavaScript.

In ASP.NET There are two way of doing it. Either we can use current request to check whether it is secured or not or we can use server variables to check whether it it secure or not just like following.

HttpContext.Current.Request.IsSecureConnection
Here in above code If this returns true then Page is secured otherwise it is not Or you can use following server variable to check the protocol.
Request.ServerVariables["SERVER_PROTOCOL"];
In JavaScript you can document.location.protocol to check whether page is secure or not. Just like following.
document.location.protocol=='https:'
So you can see its very easy to check whether page is secure or not. Hope you liked it… Stay tuned for more..
Shout it
kick it on DotNetKicks.com
Share:

Support this blog-Buy me a coffee

Buy me a coffeeBuy me a coffee
Search This Blog
Subscribe to my blog


My Mvp Profile
Follow us on facebook
Blog Archive
Total Pageviews