Visual studio 2010 Ultimate comes with one of most interesting function Historical Debugging which will change the way you debug. Let’s see what is Historical Debugging and How its works.
How historical Debugging works?
As as developer you have already faced some situations like Your tester reports a bug and you are not able to reproduce that bug in your local environment or you have very long steps to reproduce it and sometimes it reproduces under special condition and some times it does not. At that time this historical features comes into existence. With Visual Studio 2010 Ultimate Microsoft has introduced a new debugging tool intellitrace. It keeps a trace of important points of your program and its allow you to go back at that time to see what happened at that time. Isn’t that cool? that is just like rewinding your recording to edit your video.
How we can enable Intellitrace on Visual Studio 2010 ?
To enable it you need to go to the Tool->Options->Intellitrace->General just like following.
There is a check box called ‘Enable Intellitrace’. You need to check that checkbox to enable IntelliTrace (Historical Debugging). There are two radio buttons
1) IntelliTrace Event Only- This option will enable historical debugging for the events only. So it will only keep track of events only. Not all the parts of code.
2) Intellitrace events and Call Information: This option will enable historical debugging for events and inner called like method and other stuff. It records method level call but due to that your application performance can be effected. You will not get high performance from your application.
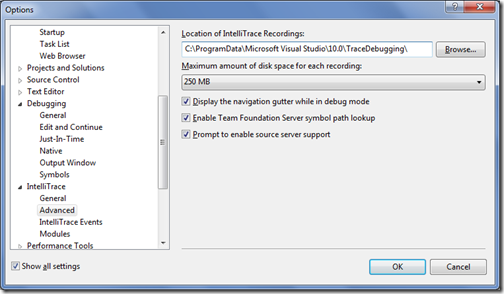
There are some advance options are also given in the options dialog box like following when you click advance in above dialog.
Here you can specify the location of the IntelliTrace Recording and Maximum size of disk space for each recording.
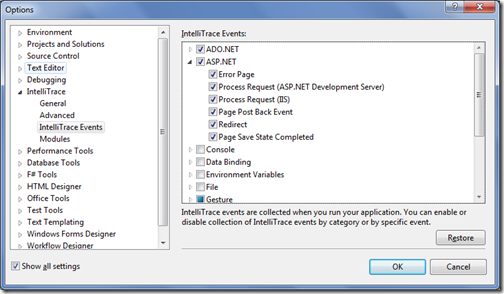
In Intellitrace Events options you can specify which kind of events you want to trace. I have enabled it on ASP.NET Project so I have options for ASP.NET and ADO.NET Enabled by default like following. But You can select events like file,Environment events and lots of options are available so you can specify that as per your requirement like following.
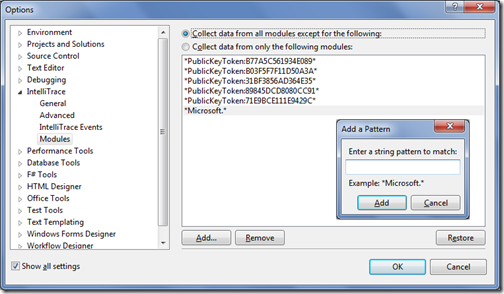
In Modules options you can select for which system modules you want to enable intellitrace if You can also add your own modules here with string pattern like following.
So,Now we all set for the Historical debugging(IntelliTrace) in Next Post I will demonstrate how historical debugging will work. Hope you liked it.. Stay tuned for more..


0 comments:
Post a Comment
Your feedback is very important to me. Please provide your feedback via putting comments.